Goodwill Hunting
summary
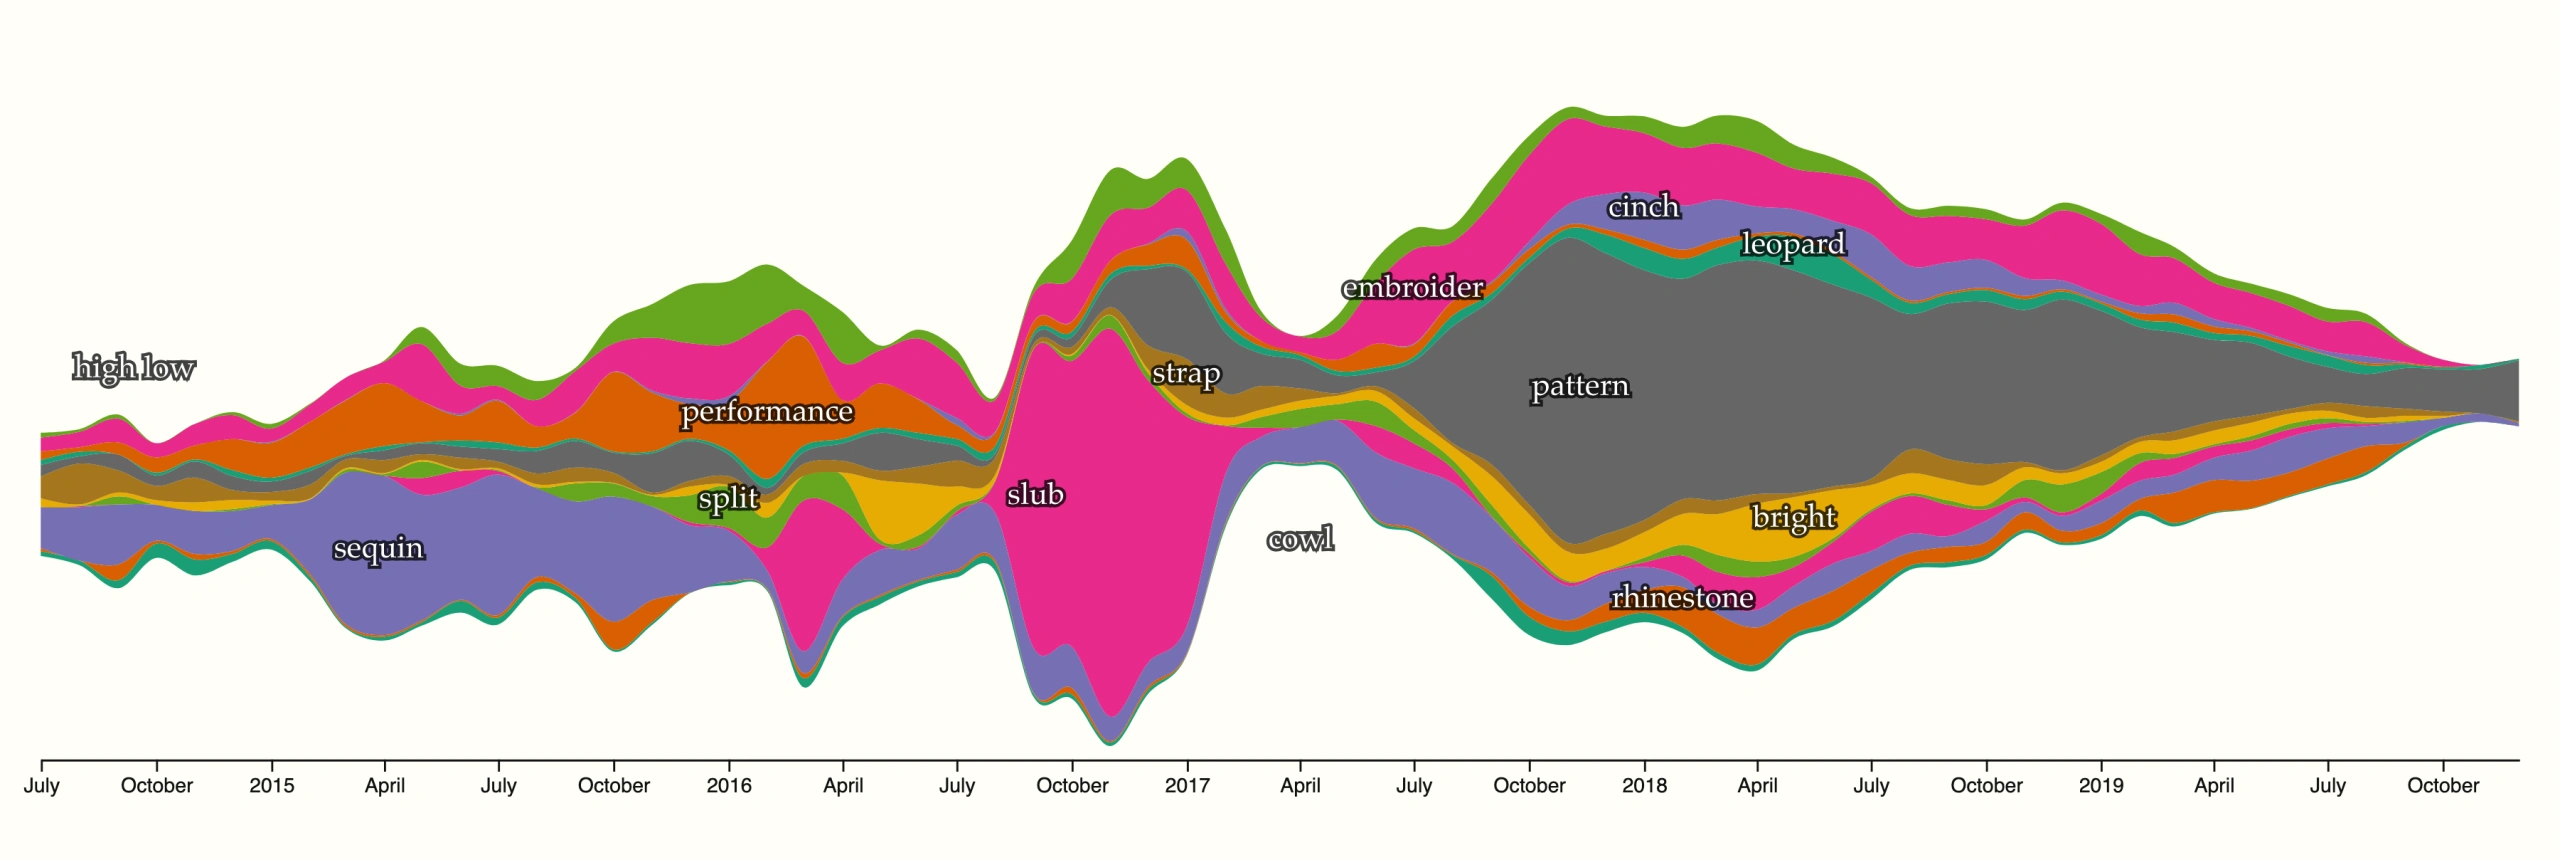
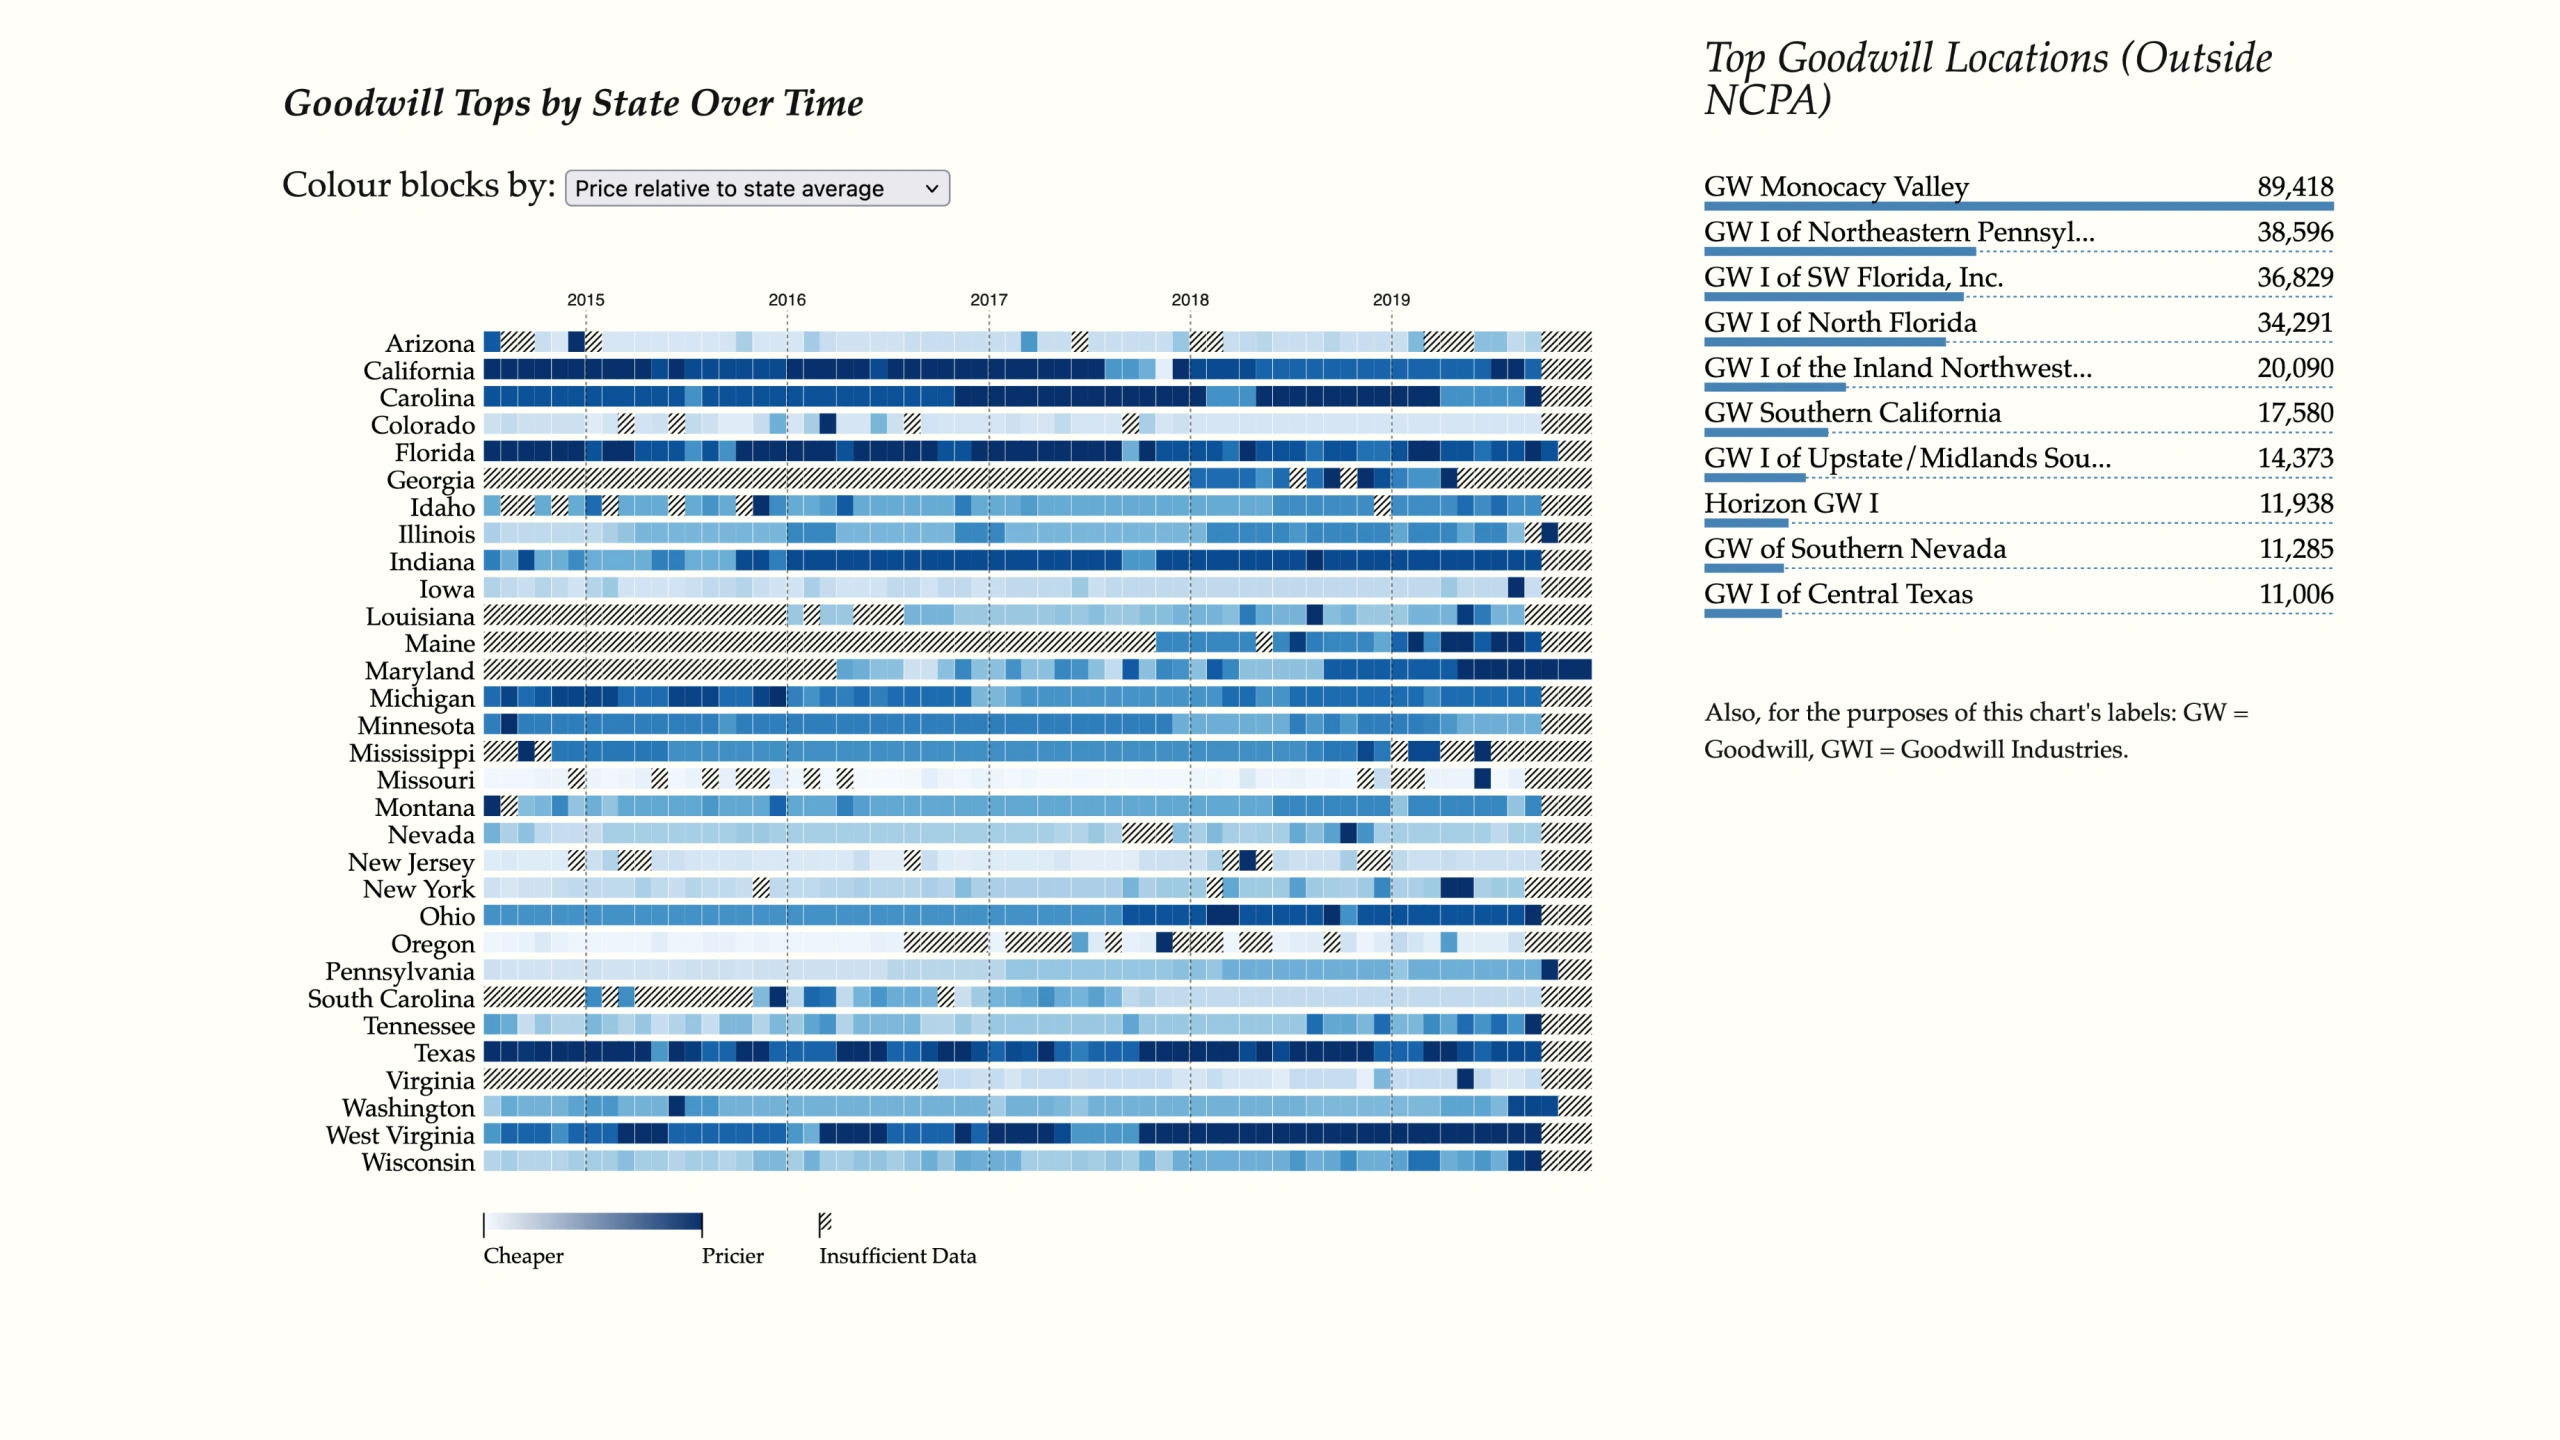
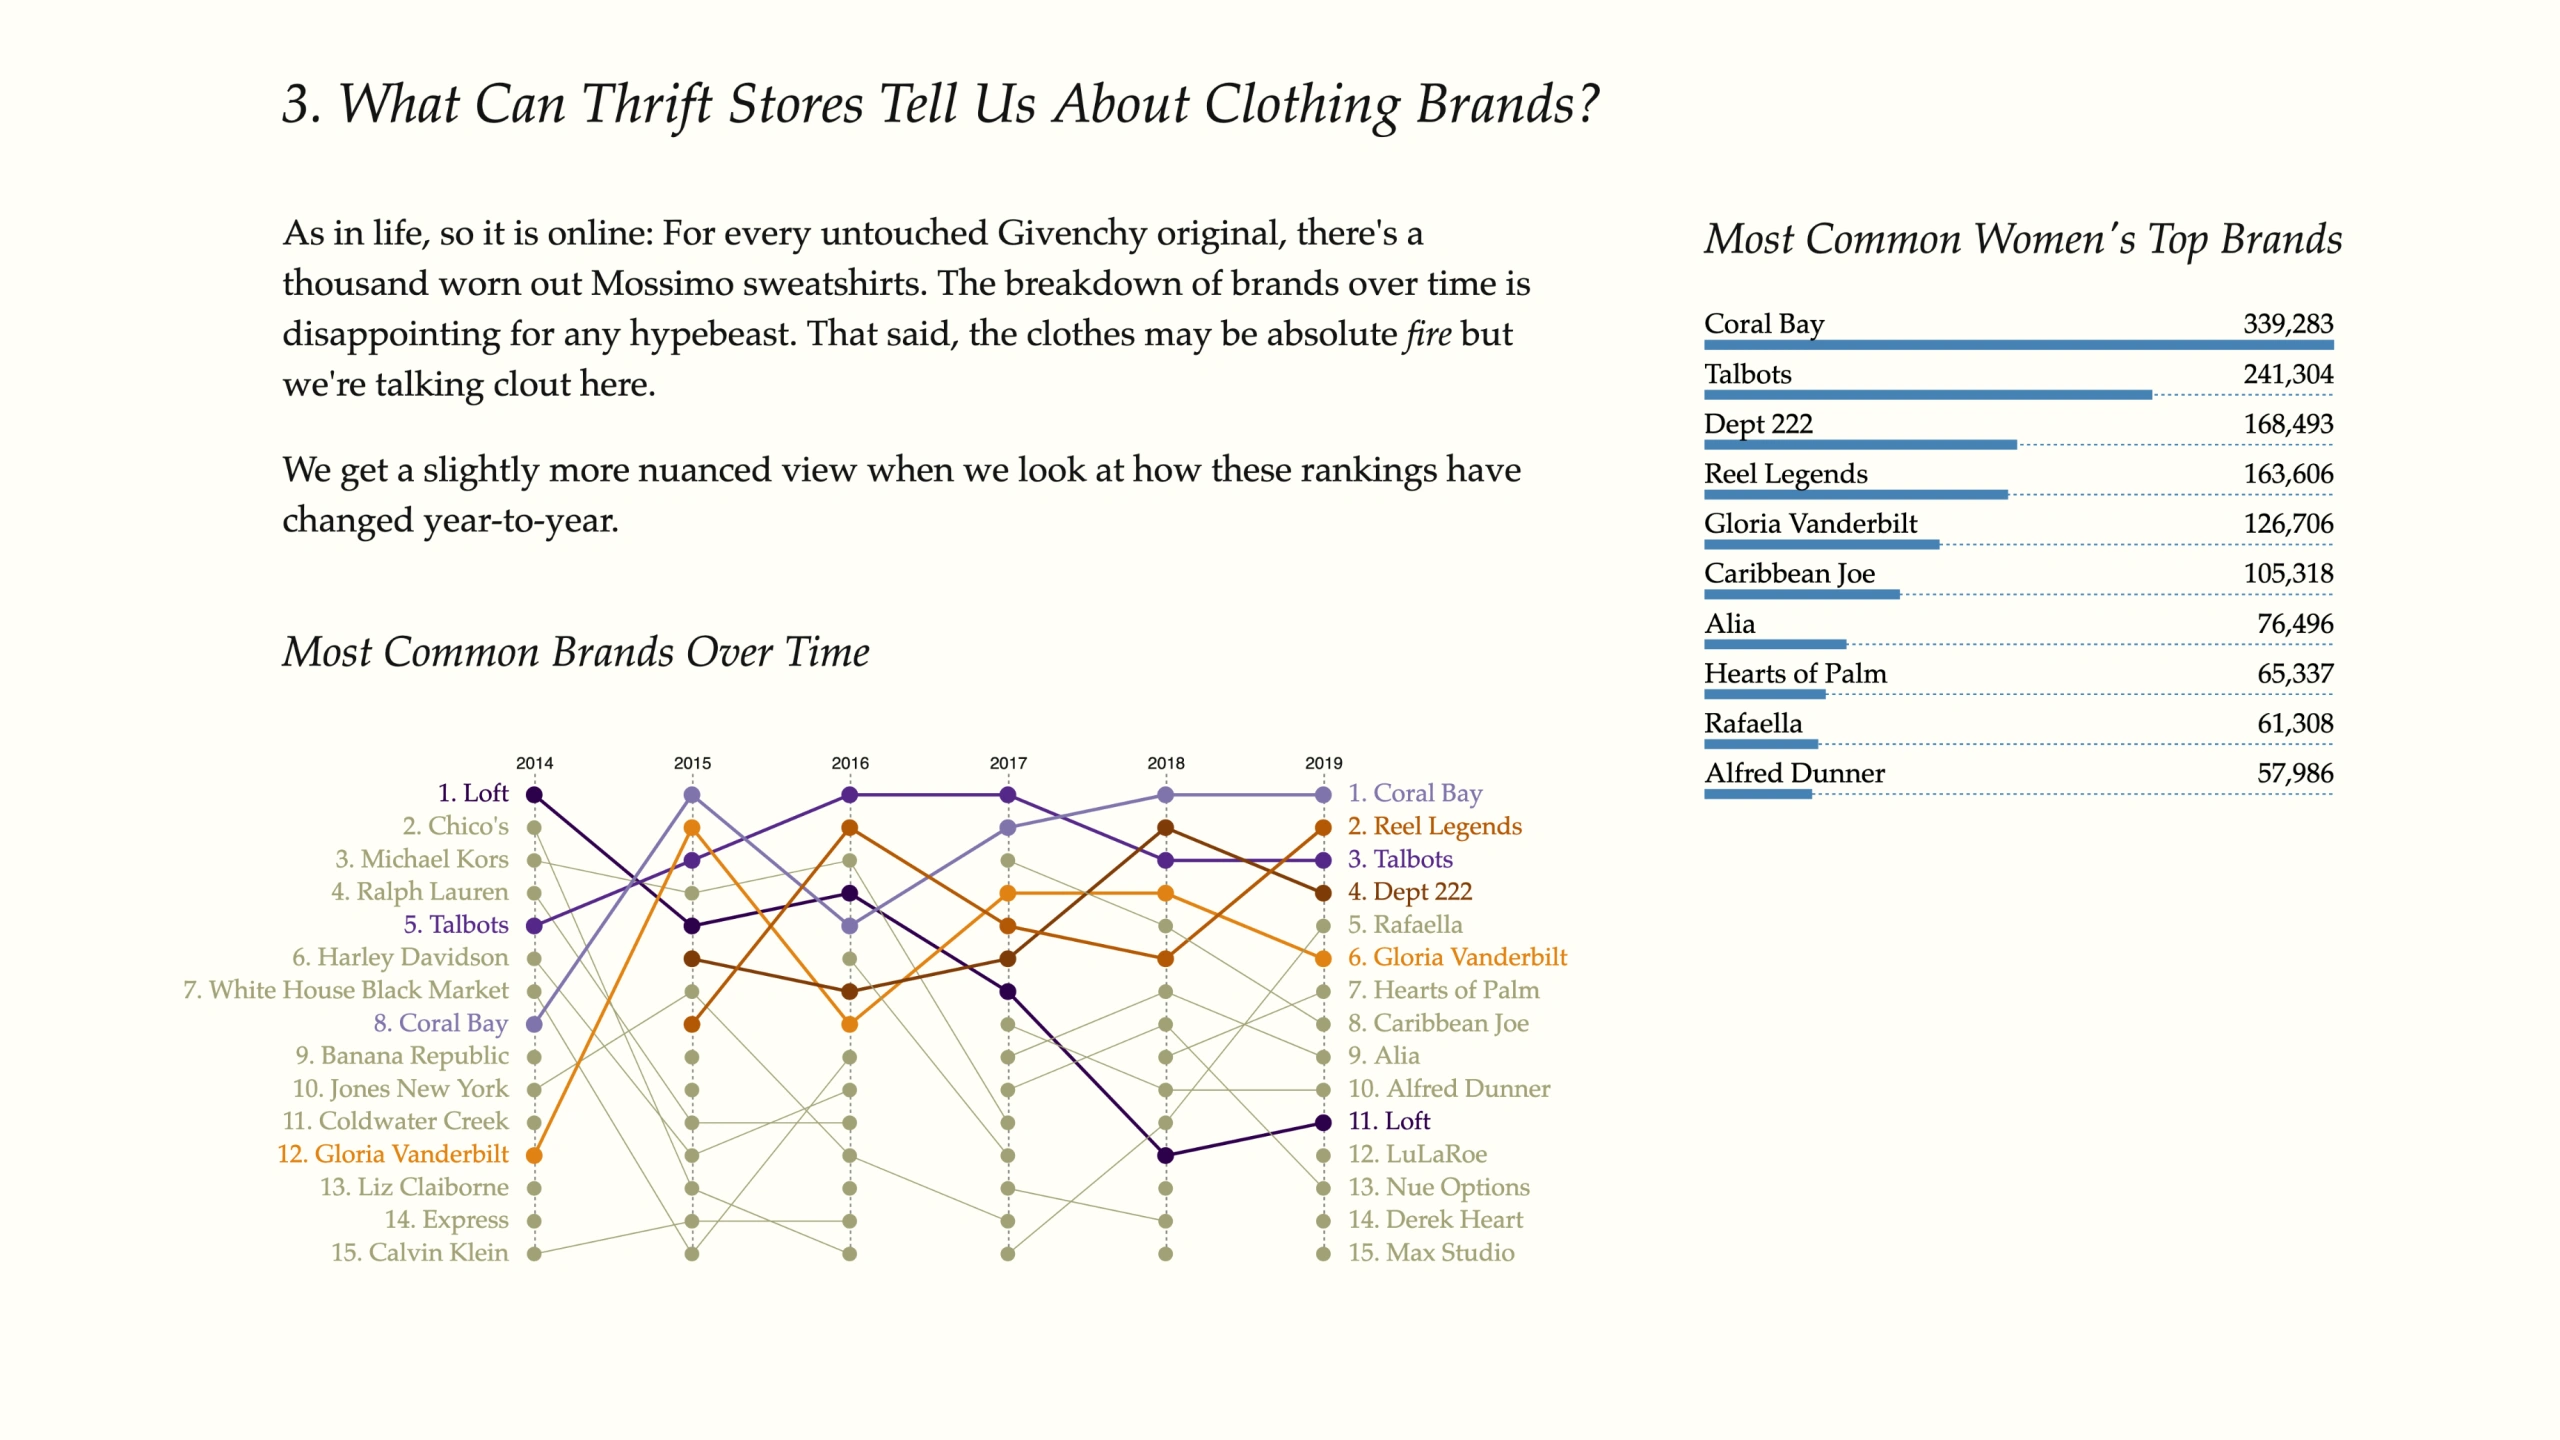
I wanted to know what types of clothes are donated to Goodwill charity shops across the USA, and make some beautiful charts about my findings.
I scraped years worth of data from the Goodwill website, and used D3 to visualize it. This project made #1 on Hacker News. It's my nerdiest claim to fame.
metadata
- Project year(s)
- 2020
details
Alongside the charts are explanations of my findings, to break down the trends I observed and highlight any known shortcomings in my data.
Goodwill Hunting is an example of how I use data, design, and written language to tell a story.
Data analysisProgramming